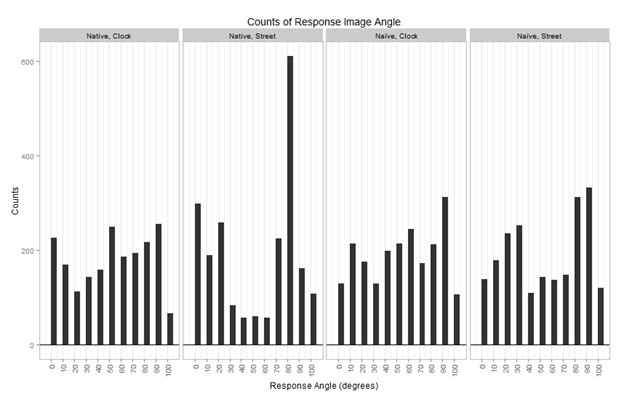
Responses at each level of context and speaker experience were significantly different from a uniform distribution (one-sample Kolmogorov-Smirnoff test, Native/Clock: D=.115, p<.001; Native/Street: D=.224, p<.001; Naïve/Clock: D=.100, p<.001; Naïve/Street: D=.163, p<.001). Because display videos were presented in equal number to all subjects, we can conclude that there is a preferential effect of clustering that produces a non-uniform multinomial distribution of responses.
Results
D values for each condition from a one-sample Kolmogorov-Smirnoff test.
| Native | Naïve | |
|---|---|---|
| Clock | .115 | .100 |
| Street | .224 | .163 |
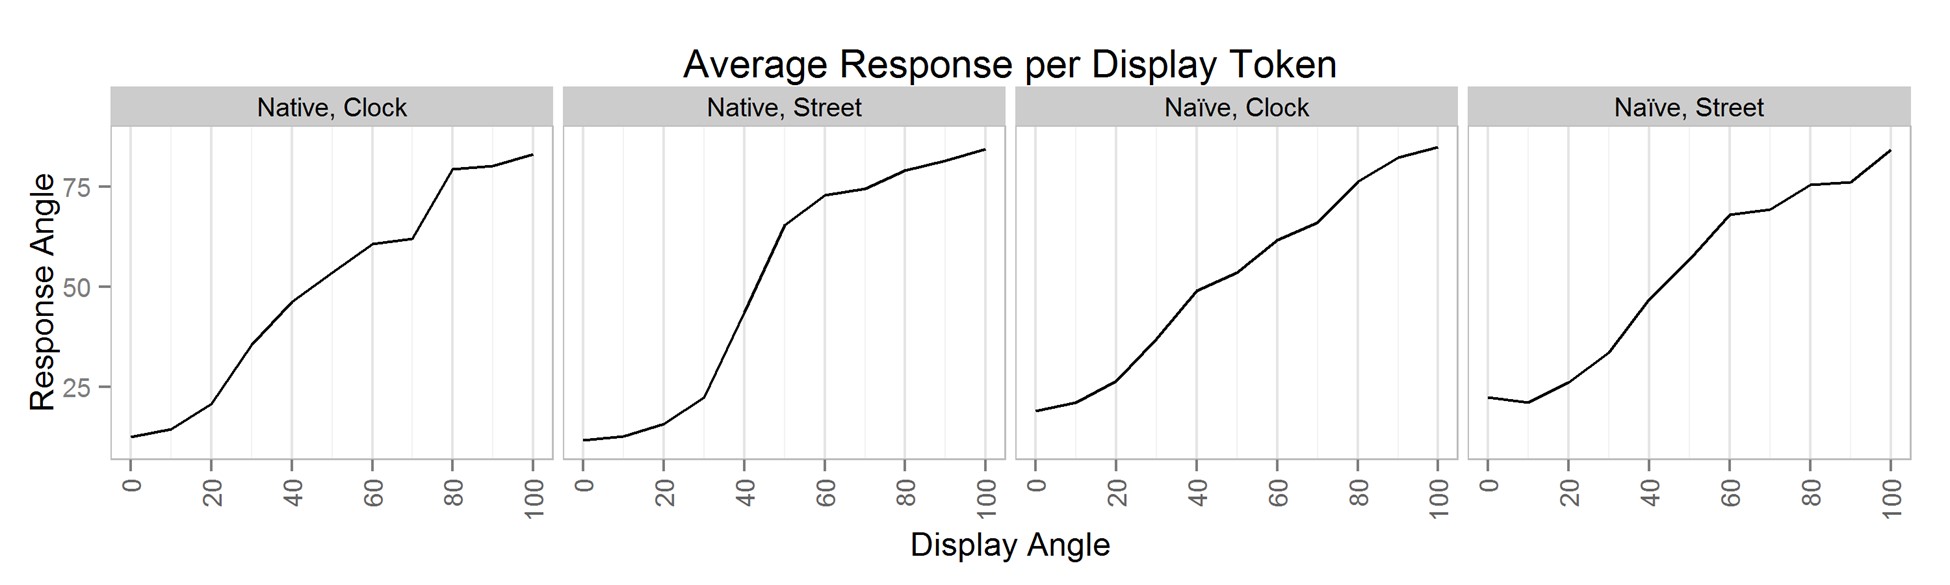
This clustering is also not equivalent in each condition. A two-sample KS test for native and naïve speakers' responses in the Street Context indicated D=.092, p<.001, so we conclude they represent samples from the different populations for both experience levels. In the Clock Context, KS test for Native and Naïve speakers indicated D=.054, p=.006, so we conclude they represent samples from the different populations for both experience levels as well. Two-sample KS tests were also performed for each speaker experience group's responses. Native speakers KS test for Street and Clock context indicated D=.154, p<.001. Naïve speaker KS test for Street and Clock contexts indicated D=.074, p<.001. The full distribution for each response condition is shown in Fig. 1 (Appendix D). Average response token for each display token is shown in Fig. 2 (Appendix E).
Appendices D & E are reproduced here for your convenience.
To measure discrimination we used a linear mixed model to describe accuracy, using speaker and context within each display token interval as fixed effects and random effects within-subject; pairwise comparisons were Tukey-adjusted to control experiment-wise error rate. Within display token intervals, there was no difference in correctness among levels of speaker or context at α=0.05, with one exception; respondents were 14% more accurate at the 30º - 40º interval in the Native,Street condition than for Native,Clock (t=-2.99, p=0.016). Percent accuracy at each interval for each condition is shown in Fig. 3 (Appendix F).